
LEARNING OBJECTIVES
After completing this unit, you’ll be able to:
- Understand the 3 types of metrics
- Know how to identify the correct metrics
- Use tools and reports to track usage
- Design an efficient feedback loop
METRICS DRIVE BEHAVIOR
Metrics are both carrot and stick when trying to drive and encourage behavior change.
There are 3 different types of metrics to capture to get the full story about user adoption.
- Business outcomes. The metrics used to manage the business and measure team member performance
- Salesforce usage. Understand the areas of Salesforce that are most used and any usage trends or patterns
- User help usage. Are the help articles helpful? Are they even looked at?

BUSINESS OUTCOMES
Sometimes these are called KPIs (Key Performance Indicators). They are the metrics that drive and reinforce user behavior. It is often said that, “we act as we are measured”. That is very true of sales teams. Change their compensation plans and their behavior changes instantly. But it is true for all of us.
Why is this relevant to Salesforce usage? If we have designed Salesforce correctly it should support the business processes. If we have chosen the KPIs that reinforce the business processes, they will also encourage the correct use of Salesforce.
So it is important that we track the right metrics, even if they are difficult to calculate. It is better to have no metrics than the wrong ones. The best way to understand what metrics to track is to document the end-to-end business process. As you do, identify what it would be possible to measure, and what’s important (and most important) to business performance. Don’t be fooled into measuring those that are most easily captured.
Also try to capture leading metrics that help you identify future problems, rather than lagging indicators that report on the past.
This is all covered in more detail in this blog Analytics – Leading or lagging metrics? Here is a quote from it:
Think about driving alongside a pavement crowded with shoppers. A pedestrian steps out and thanks to your lightning reactions and the ABS on your car you manage to avoid hitting them. So ‘agility’ is whether you are able to respond if something jumps out in front of you. The measure is “did you hit them”. You could have been just as ‘agile’, but required a far less violent reaction if you had been alert to the possibility and had had earlier warning of the pedestrian’s actions.
Put another way. Are the Key Performance Indicators (KPIs) that you are using to make your decisions leading indicators or lagging indicators? Things can start to go wrong in a business well before the performance measure turns the traffic light on your scorecard red. Using metrics that measure past events is like driving while looking through the rear window. You can easily miss the opportunity or threat on the road ahead until you’re upon it.
Salesforce usage
Salesforce itself has powerful tools that can provide insight into how users are interacting with the application. Some early indicators of success include login rates, record creation, and record updates. Login rates track how often users are logging in to Salesforce. Record creation and record updates show you if and how often users are interacting with the data.
The Trailhead unit Measure Salesforce Usage covers this in some detail. It suggests that you install the free Adoption Dashboards app which is on the AppExchange. There is also a set of useful analytics inside Salesforce Setup called Lightning Usage.
User help usage
If you have added help to objects and fields, is it actually helping? Tracking if help articles are opened and if they are valuable to users enables you to fine tune them.
The Lightning Usage metrics will help you identify the most frequently used, and most complex record pages, so you understand where it’s most important to create help topics. Elements provides rich analytics on help page usage and feedback to make it quick and painless to assess help effectiveness. Start with the most frequently read help topics. Look at improving the help, and possibly the page layouts as well. One idea is to give each help topic an ID number that must be quoted when raising a support ticket.
FEEDBACK
You will not get it 100% right. Users will do dumb, unexpected things. You will not have thought of certain use cases and provided training for it. What is important is that you have a very efficient process for identifying and reporting problems and then fixing them.
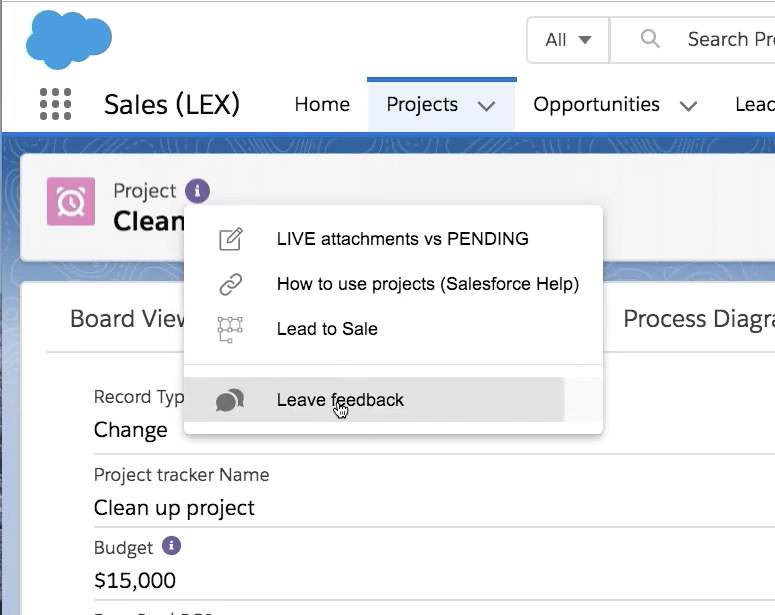
Every object feedback form, even if there are no help topics. Start collecting feedback and then responding quickly. Responsiveness build trust and support with end users. Once a field has help topics, it will also have a feedback form.
Scenario 1: [BAD]
A user has an issue and cannot understand why some validation rules are preventing the record saving. There is NO feedback mechanism. They enter (bad) data into fields they don’t understand just to be able to satisfy the validation and save the record. They go on with their lives. No one notices. Einstein predictions are impacted. Sales ops, service and marketing are now working off bad data. How many times is this happening every day?
Scenario 2: [BETTER]
A user has an issue and cannot understand why some validation rules are preventing the record saving. There is help but not enough to explain the validation problem. They post feedback. You respond by adding a new help topic to the 2 fields with validation rules that are required. That takes 5 minutes. You ask the user to try again. Success. The data entered is correct. Future users are more likely to enter the correct data.
Feedback combined with the ability to have easily created and maintained help topics can give you Scenario 2.
Why not design your feedback loop as a process diagram in Elements and publish it?